BEST PRICE FS ADVISORY SERVICES – (BEST PRICE ADVICE)
IMPORTANT – A MUST READ ARTICLE
Quality Investment Results against the backdrop of uncertain Political and Economic outcomes when compared to the relative Risk Benchmarks.
Political and Economic Risks

The dreaded B-word (Brexit) continues to dominate the media in the UK.
The position remains so fluid that the news and updates change hourly, rather than daily, weekly or monthly.
Division clearly continues between society, the Commons and Government ministers. The outcome remains unclear, with all the political brinksmanship in play, where we are sometimes suffering “Ground hog” days with no clear way forward. The Brexit crisis seems set to drag on and on and on…. regardless of the “olive vine” extended to Labour ….
The “Road to nowhere” analogy remains in my view!

The country is so divided with Ministers and Parliament currently unwilling to find a solution, there is likely to be an ongoing political mess, potentially leading to an early General Election, which is creating an effect on confidence, leading to bouts of negative sentiment and “risk off” selling which culminated in the “Christmas Crash” although, to be fair, sentiment and confidence generally had turned increasingly negative from the mid year point (which was the high point of the global markets) as Global Trade concerns spooked the Investment markets.
Investment Market Falls
The Global Markets had fallen heavily from late September/October 2018 to nearing the bottom of the market at, or around, 26 December 2018. an example of this was the FTSE 100 peak to trough falls of 7859.20 (20 May 2018) to 6584.70 (26 December 2018). (The FTSE 100 is currently sat at 7389.58 @ 14.33 on 2 April 2019).
The Dow Jones Industrial Average also saw a reduction of around 15% – falling from 26773 on 1 October 2018 to 21792.20 on 23 December 2018. (The index is currently trading at 26174.79 @ 14.33 on 2 April 2019).
Emerging Markets had suffered greater reductions, which were earlier due to Dollar strength and trade concerns.
Comparing the results of our medium Risk 5 Model Portfolio the reductions in value approached 4% over a similar time frame, which produced quality results when considered against peers and relative benchmarks. (More detail to follow in respect of performance data).
THE MAIN MARKET INDEXES WERE OFF BETWEEN 15-25% during this period.
The investment risk models are designed to have the Ronseal effect – “do as it says on the tin” – the lower the risk, the lower the asset price reduction, although the longer term performance is unlikely to provide results a higher (more volatile) risk model produces over time, which you will see from the table. It is imperative that investors understand that ‘markets’ produce ‘investment market risk’ so unless the investments are held in lower volatility cash like holdings at times of market turbulence, the value of invested assets WILL fall, which is why we (as a business) write to investors regularly to provide updates in relation to investment markets and potential economic impacts – sometimes too often maybe?!!
I/we do our best to make our communication clear to understand, although I understand that financial matters can be complex and sometimes dull and boring… (Personally, I find the subject amazing, sexy and as much fun as one can get; most wouldn’t agree! Lol)
Market Risk
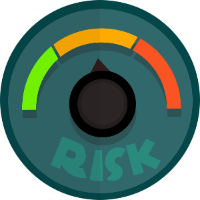
Investing always creates “investment market risk” for the investor, but having a balance of quality assets included in a long term investment portfolio and reviewed against a risk brief and reviewed regularly produces the best investment outcomes…. which is illustrated in our performance summary provided.
Concerns

A short term economic downturn may develop from the political environment we are currently “living through”. I am concerned about wider market contagion, although there is little evidence to suggest a larger systemic risk impact, such as the financial crisis again developing, that being said, no one knows what lies ahead. Corporate earnings may naturally reduce while there is a “reason” to hold back on investment limiting growth/expansion within markets – cost cutting and mergers seem to be the focus of most businesses, so how does this lead/filter through to investment markets? If investment is made by companies, it’s generally into digital technology.
The future is never clear, which is why it is so very important to be positioned with balance in quality assets… and rebalance these assets over time; as crystal ball gazing and market timing rarely pay off… Making “rear view mirror” decisions is simple, but we don’t have this “benefit” in the real world.
The “Christmas crash” synchronised many global concerns that were mainly created by politics, moving into Economic concerns and disruption; producing a “Risk Off” selling view.
Further synchronised concerns are likely to develop, impacting sentiment. No one will know when this is “likely” to develop – which is why a quality, balanced investment portfolio is essential, where investors remain committed and confident through investment market cycles and downturns.
Sterling is likely to continue as a barometer of the Brexit outcome. Watch the FX space… (remembering that we can now provide exceptional FX transaction terms to our clients when they need to move money around the globe). Follow the blog updates and economic data runs on our blog – https://www.bestpricefs.co.uk/blog/april-2nd-market-updates/ or get a currency quote online – https://www.bestpricefs.co.uk/app/foreign-exchange/
Friday sees the release of the USA’s jobs data which is expected to improve, confirming that the US economy remains strong. Investors must nevertheless expect the unexpected with the political turmoil in play, where “speed bumps” are likely to appear in the investment road ahead of us.
Outstanding Investment Results
Please take the time to read the results obtained from our Risk Models. the results are again extremely pleasing, illustrating huge “value add” relative to Risk.
If this detail needs explaining personally, simply get in touch.
Risk Model 2
Not generally recommended for growth. Some investors move to a Risk Model 2 when they feel a “Risk off” is best for their needs.
Historic Risk Score 1
Prospective Risk Score 2
Portfolio volatility 2.77
Benchmark – Weighted Sector Average
| 1m | 3m | 6m | 1yr | 2yr | 3yr | 4yr | 5yrs | Since 19/6/14 | |
| Portfolio | 1.20 | 3.28 | 1.39 | 3.29 | 6.27 | 11.15 | 11.16 | 16.36 | |
| Benchmark | 1.06 | 2.71 | 0.72 | 2.35 | 3.83 | 9.31 | 10.17 | 15.19 |
Difference – out performance, relative to risk
| 0.14 | 0.57 | 0.67 | 0.94 | 2.44 | 1.84 | 0.99 | 1.17 |
Risk Model 3
Historic Risk Score 2
Prospective Risk Score 3
Portfolio volatility 4.17
Benchmark – Mixed Investment 0-35% Shares
| 1m | 3m | 6m | 1yr | 2yr | 3yr | 4yr | 5yrs | Since 19/6/14 | |
| Portfolio | 1.95 | 5.29 | 1.69 | 4.95 | 9.00 | 19.22 | 19.18 | 27.35 | |
| Benchmark | 1.51 | 3.91 | 0.74 | 3.10 | 3.23 | 13.01 | 10.65 | 17.94 |
Difference – out performance, relative to risk
| 0.43 | 1.38 | 0.95 | 1.85 | 5.77 | 6.21 | 8.53 | 9.41 |
Risk Model 4
Historic Risk Score 2
Prospective Risk Score 4
Portfolio volatility 4.67
Benchmark – Mixed Investment 20-60% Shares
| 1m | 3m | 6m | 1yr | 2yr | 3yr | 4yr | 5yrs | Since 19/7/10 | |
| Portfolio | 2.20 | 6.25 | 1.65 | 5.77 | 9.84 | 20.09 | 19.73 | 30.65 | 91.01 |
| Benchmark | 1.68 | 5.38 | -0.38 | 3.41 | 4.28 | 17.79 | 14.79 | 24.34 | 56.30 |
Difference – out performance, relative to risk
| 0.52 | 0.87 | 2.03 | 2.36 | 5.56 | 2.30 | 4.94 | 6.31 | 39.71 |
Risk Model 5
Historic Risk Score 2
Prospective Risk Score 5
Portfolio volatility 5.25
Benchmark – Mixed Investment 20-60% Shares
| 1m | 3m | 6m | 1yr | 2yr | 3yr | 4yr | 5yrs | Since 19/7/10 | |
| Portfolio | 2.22 | 6.37 | 1.52 | 5.92 | 9.90 | 22.04 | 21.80 | 34.02 | 105.66 |
| Benchmark | 1.68 | 5.38 | -0.38 | 3.41 | 4.28 | 17.79 | 14.79 | 24.34 | 56.30 |
Difference – out performance, relative to risk
| 0.54 | 0.99 | 1.99 | 2.51 | 5.62 | 4.25 | 7.01 | 9.68 | 49.36 |
Risk Model 6
Historic Risk Score 3
Prospective Risk Score 6
Portfolio Volatility 6.05
Benchmark – Mixed Investments 20-60% Shares
| 1m | 3m | 6m | 1yr | 2yr | 3yr | 4yr | 5yrs | Since 18/7/12 | |
| Portfolio | 2.50 | 7.24 | 1.45 | 6.78 | 11.06 | 25.30 | 24.27 | 40.01 | 84.01 |
| Benchmark | 1.68 | 5.38 | -0.38 | 3.41 | 4.28 | 17.79 | 14.79 | 24.34 | 42.83 |
Difference – out performance, relative to risk
| 0.82 | 1.86 | 1.83 | 3.37 | 6.78 | 7.51 | 9.48 | 15.67 | 41.18 |
Risk Model 7
Historic Risk Score 3
Prospective Risk Score 7
Portfolio Volatility 7.54
Benchmark – Mixed Investment 40-85% Shares
| 1m | 3m | 6m | 1yr | 2yr | 3yr | 4yr | 5yrs | Since 19/6/14 | |
| Portfolio | 2.75 | 8.47 | 0.80 | 8.22 | 13.54 | 31.14 | 27.87 | 45.49 | |
| Benchmark | 2.06 | 7.12 | -1.35 | 5.47 | 6.93 | 25.93 | 22.13 | 32.94 |
Difference – out performance, relative to risk
| 0.69 | 1.35 | 2.15 | 2.75 | 6.61 | 5.21 | 5.74 | 12.55 |
Risk Model 8
Historic Risk Score 3
Prospective Risk Score 8
Portfolio Volatility 7.70
Benchmark – Flexible Investment
| 1m | 3m | 6m | 1yr | 2yr | 3yr | 4yr | 5yrs | Since 29/3/10 | |
| Portfolio | 2.81 | 9.28 | 0.64 | 8.82 | 14.65 | 35.63 | 32.75 | 51.63 | 123.29 |
| Benchmark | 1.86 | 6.77 | -1.76 | 4.58 | 6.27 | 24.91 | 20.12 | 32.32 | 65.23 |
Difference – out performance, relative to risk
| 0.95 | 2.51 | 2.40 | 4.24 | 8.38 | 10.72 | 12.63 | 19.31 | 58.06 |
Benchmark – 40-85% Shares
| 1m | 3m | 6m | 1yr | 2yr | 3yr | 4yr | 5yrs | Since 29/3/10 | |
| Portfolio | 2.81 | 9.28 | 0.64 | 8.82 | 14.65 | 35.63 | 32.75 | 51.63 | 123.29 |
| Benchmark | 2.06 | 7.12 | -1.35 | 5.47 | 6.93 | 25.93 | 22.13 | 34.07 | 68.96 |
Difference – out performance, relative to risk
| 0.75 | 2.16 | 1.99 | 3.35 | 7.72 | 9.70 | 10.62 | 17.56 | 54.33 |
Risk Model 9
Historic Risk Score 4
Prospective Risk Score 8 (due to volatility Risk/Return charts @ 8.80 rather than 9)
Portfolio Volatility 8.80
Benchmark – Flexible Investment
| 1m | 3m | 6m | 1yr | 2yr | 3yr | 4yr | 5yrs | Since 29/3/10 | |
| Portfolio | 3.30 | 10.08 | 0.62 | 9.62 | 16.14 | 43.42 | 41.47 | 67.32 | 157.48 |
| Benchmark | 1.83 | 6.77 | -1.76 | 4.58 | 6.27 | 24.91 | 20.12 | 32.32 | 65.23 |
Difference – out performance, relative to risk
| 1.17 | 3.31 | 2.38 | 5.04 | 9.87 | 18.51 | 21.35 | 35.00 | 92.25 |